
Influence of the load profile
The load profile of a boiler system has a significant influence on the selection of boiler systems. The best way to select the boiler outputs is to use a structured annual load duration curve. In the annual load duration curve, the hourly output from a load profile can be determined according to heat energy demand for a specific period (usually one year).
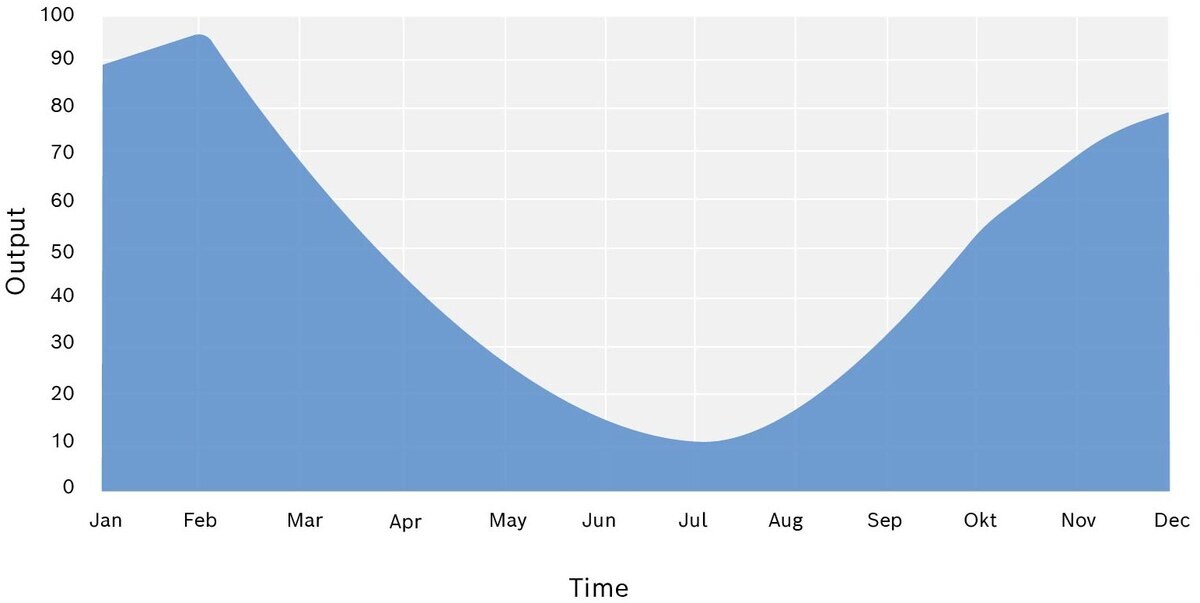
Unstructured load curve of a heating application for one year
In the structured annual load duration curve, the required output of heat consumers is sorted not chronologically but according to size.
The highest value is on the far left and corresponds to the maximum value, while the lowest value is on the far right and corresponds to the minimum value.
The horizontal axis shows the number of hours in a year, while the vertical axis shows the respective value of the power required.
This can then be used to determine for how many hours per year a particular output is required. It is possible to read off the peak output required for only a few hours per year and also the minimum load that is almost always present. The area under the curve corresponds to the output to be achieved during the year.
The graph “Structured annual load duration curve” shows the typical curve of a hot water system for a heating application. The peak demand of more than 60 % of the maximum power is only required for approximately 900 operating hours [1]. For most of the year (spring, autumn and the warm days of winter), the power requirement is 60 – 30 % of the maximum load [2]. For the rest of the year, only the domestic hot water demand is covered [3].
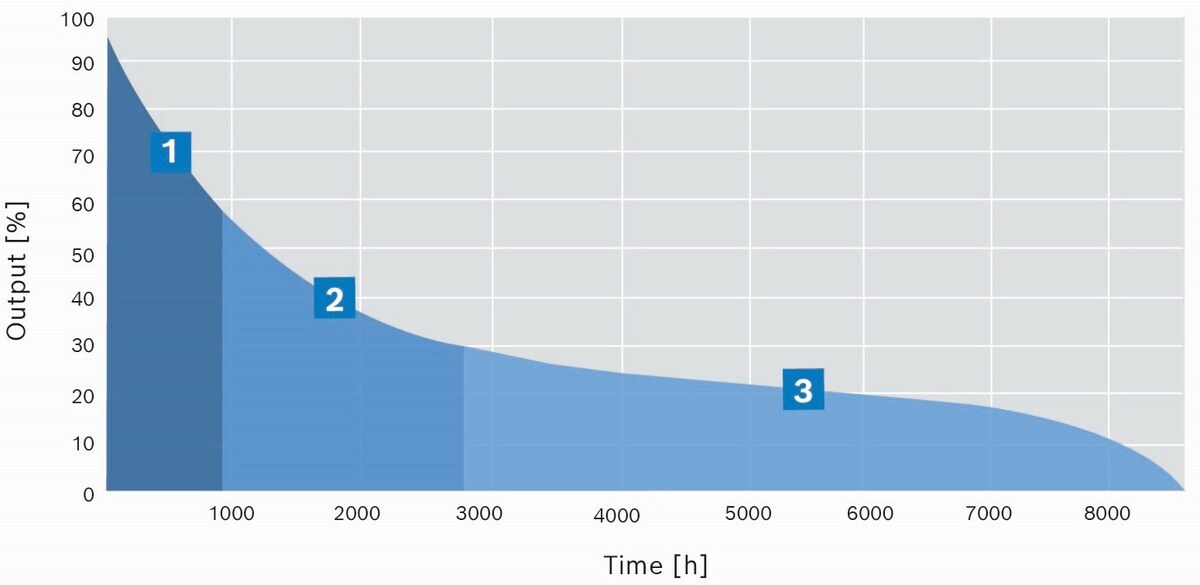
Structured annual load duration curve of a heating application
The following graphic shows the typical development of a large brewery. A high output of more than 70 % for 4,000 operating hours is normally required for the work process on all working days of the year [1]. A sharp drop in heat energy demand can be observed between 4,000 – 6,000 operating hours [2]. At weekends and during holiday periods, only a low load is required [3].
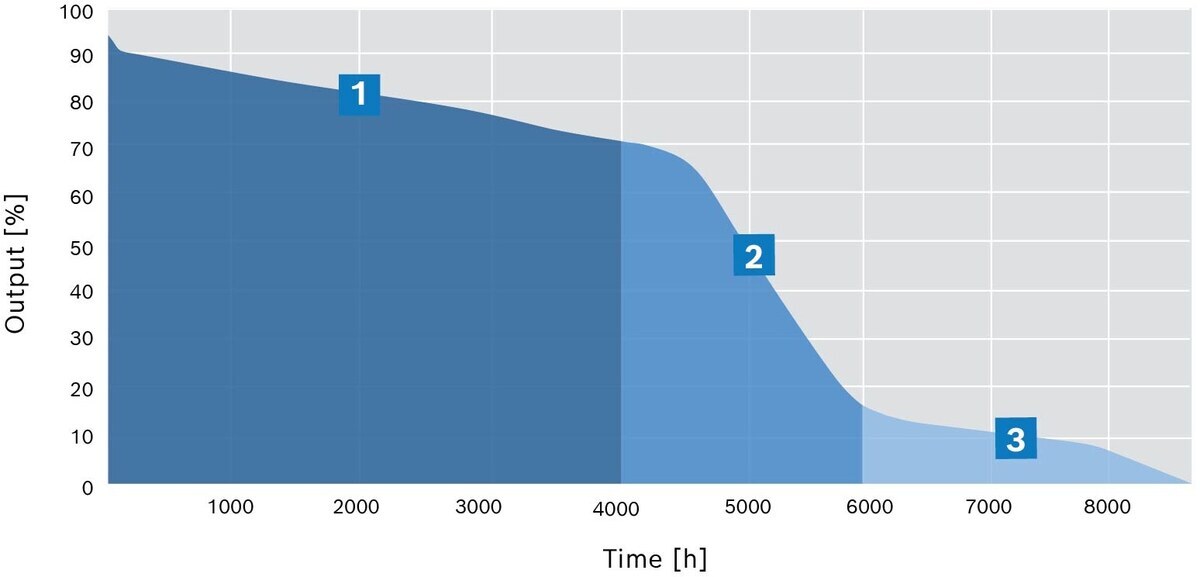
Annual load duration curve for industry, using a brewery as an example
Planning boiler systems based on an annual load duration curve for the heating load
Planning based on the annual load duration curve ensures that boiler systems are optimally designed to meet the requirements of heat consumers both economically and technically.
Recording the heating load data
First, the heating loads are recorded throughout the year. The heating load varies depending on the heat energy demand of the system. This data is collected and stored hourly.
Creating the annual load duration curve
The recorded data is then sorted by size, starting with the highest heating load. This results in a descending curve that shows how often a certain heating capacity is required during the year. The highest point on the curve represents the peak load, which is only required for a few hours per year.
Boiler output analysis
The annual load duration curve helps to determine the optimal heating or hot water boiler or a combination of several boilers. The curve can be used to determine how large the boiler should be. For example, one boiler can be designed for the average load (the majority of the year), while an additional, smaller boiler or a reserve boiler is provided for peak loads.
Dimensioning and redundancy planning
It is inefficient to design a heating or hot water boiler solely for maximum load, as this peak load is rarely reached. One of the boilers is therefore dimensioned to cover the majority of the annual load. For the rare peak loads, a second, smaller boiler or an alternative heating method is often planned. This means that the system can be operated efficiently and economically. The use of multiple boilers also ensures redundancy and thus greater security of supply.
Optimising the operating times
The annual load duration curve also shows how often the boiler would run under partial load. This allows operating times to be optimised and can help to maximise the efficiency of the system.