
Practical illustration of the increase in water-side efficiency
A boiler system with the following design data is assumed:
- 1,700 kW boiler output
- 110 °C safety temperature limiter
- Boiler supply flow temperature: 90 °C
- Boiler return flow temperature:
A 20 K temperature difference: 70 °C
B 30 K temperature difference: 60 °C
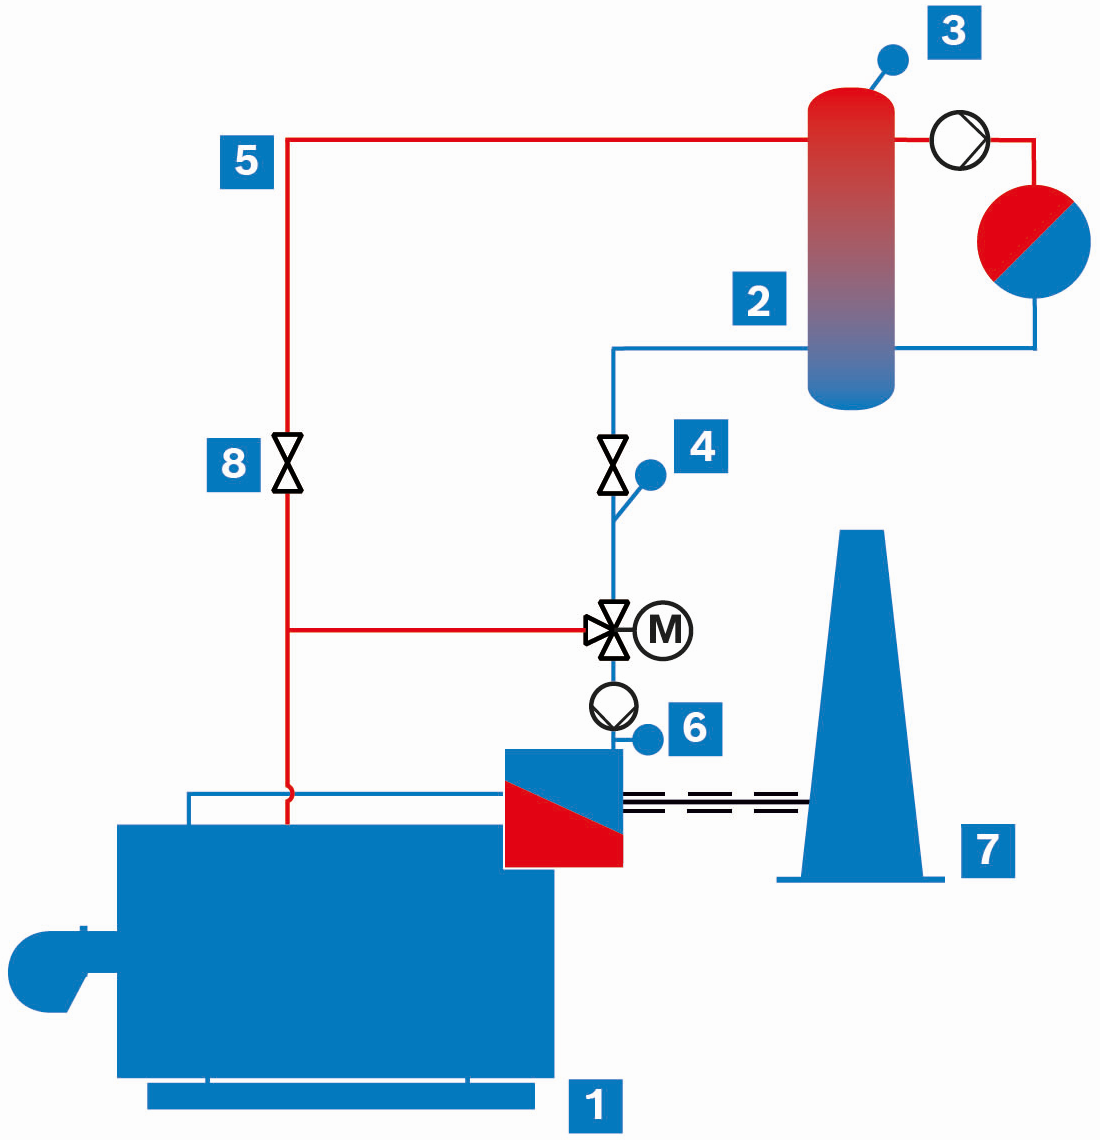
Hydraulics for increased water-side efficiency
|
|
Hot water boiler |
|
|
Low loss header |
|
|
Network flow temperature |
|
|
Boiler return flow temperature |
|
|
Boiler supply flow temperature |
|
|
Eco intake temperature |
|
|
Chimney |
|
|
Shut-off valve |


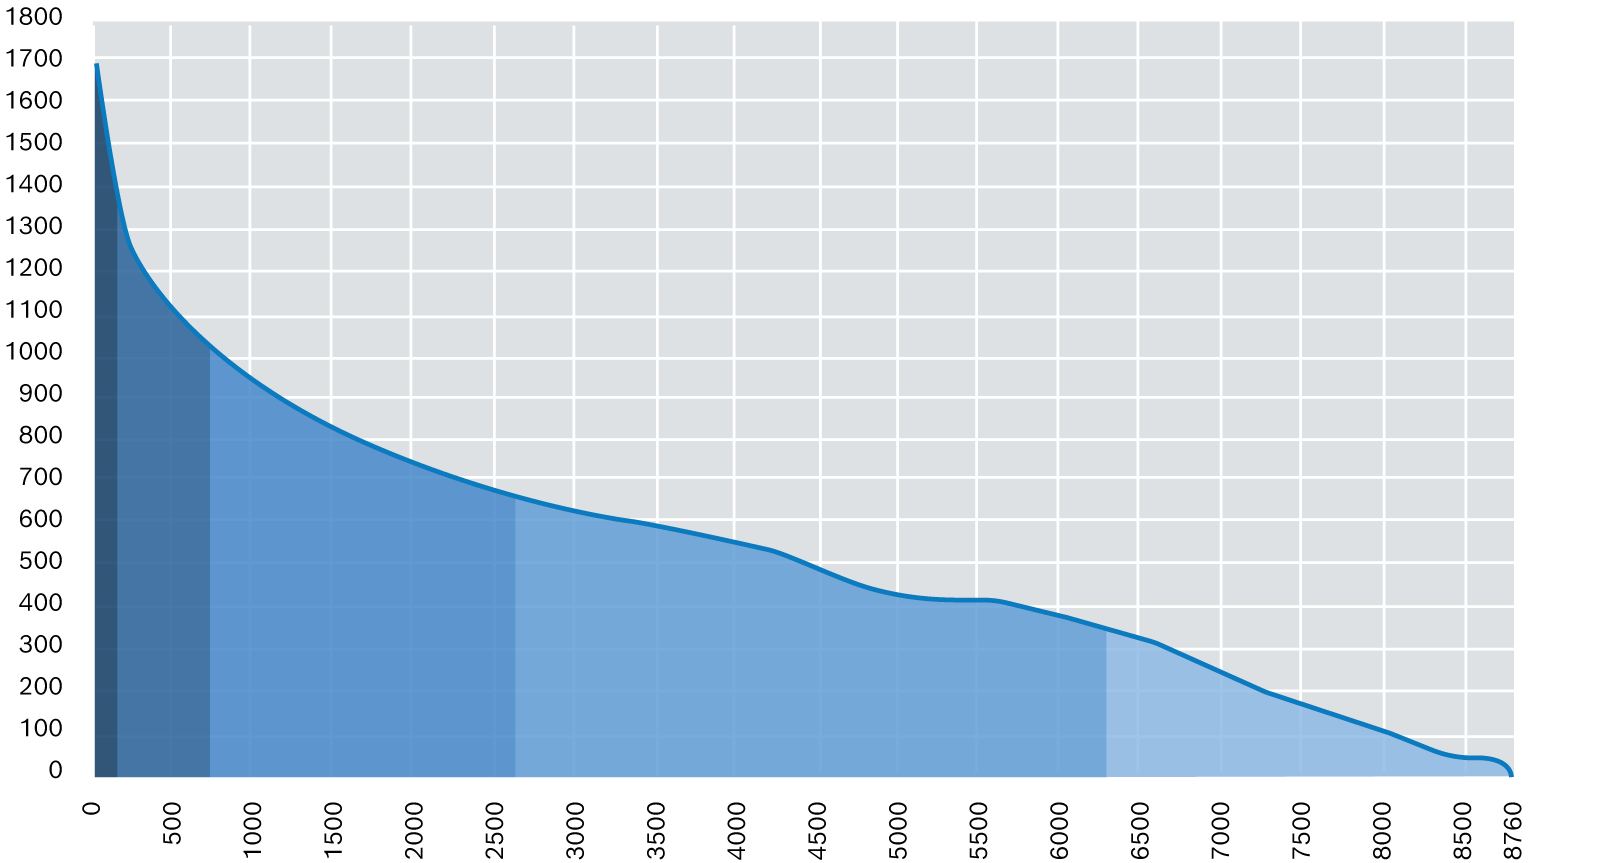
Figure showing load ranges for a heating system with a maximum load requirement of 1,700 kW
|
Scenario A |
Scenario B |
|
|
Volume flow through boiler |
75 m³/h |
50 m³/h |
|
Boiler circuit pump rated output |
1.5 kW |
1.1 kW |
|
Boiler system efficiency |
96 % |
96.3 % |
|
Scenario A: ΔT 20 K |
||||||
|
Pump output: 1.5 kW |
||||||
|
System load range |
1 | 2 | 3 | 4 | 5 | Total |
|
Boiler load range [%] |
100–80 | 80–60 | 60–40 | 40–20 | 20–0 | |
|
Operating hours [h] |
125 | 600 | 1,850 | 3,500 | 2,685 | 8,760 |
|
Pump with frequency converter [kWh] |
221 | 447 | 408 | 167 | 128 | 1,370 |
|
Pump without frequency converter [kWh] |
188 | 900 | 2,775 | 5,250 | 4,028 | 13,140 |
|
Boiler system efficiency [%] |
96 | 96.4 | 96.8 | 96.5 | 96.5 | |
|
Fuel consumption of natural gas H [m³N] |
19,248 | 71,562 | 156,955 | 179,650 | 137,103 | 564,518 |
| Power consumption [kWh] |
Electricity costs [€/kWh] |
Total [€] |
||||
|
Power consumption of boiler circuit pump |
13,140 | 0.2 | 2,628 | |||
|
Power consumption of boiler circuit pump |
1,370 | 0.2 | 274 | |||
| Savings | 2,354 | |||||
| Fuel consumption [m³N/h] |
Gas costs [€/m³N] |
Gas costs [€/kWh] |
Total [€] |
|||
|
Fuel consumption |
564,518 | 0.5175 | 0.05 | 292,138 | ||
|
Scenario B: ΔT 30 K |
||||||
|
Pump output: 1.1 kW |
||||||
|
System load range |
1 | 2 | 3 | 4 | 5 | Total |
|
Boiler load range [%] |
100 – 80 | 80 – 60 | 60 – 40 | 40 – 20 | 20 – 0 | |
|
Operating hours [h] |
125 | 600 | 1,850 | 3,500 | 2,685 | 8,760 |
|
Pump with frequency converter [kWh] |
150 | 303 | 277 | 113 | 87 | 930 |
|
Pump without frequency converter [kWh] |
138 | 660 | 2,035 | 3,850 | 2,954 | 9,636 |
|
Boiler system efficiency [%] |
96 | 97 | 97 | 97 | 97 | |
|
Fuel consumption of natural gas H [m³N] |
19,188 | 71,266 | 156,470 | 177,798 | 136,396 | 561,118 |
| Power consumption [kWh] |
Electricity costs [€/kWh] |
Total [€] |
||||
|
Power consumption of boiler circuit pump |
9,636 | 0.2 | 1,927 | |||
|
Power consumption of boiler circuit pump |
930 | 0.2 | 186 | |||
| Savings | 1,741 | |||||
| Fuel consumption [m³N/h] |
Gas costs [€/m³N] |
Gas costs [€/kWh] |
Total [€] |
|||
|
Fuel consumption |
561,118 | 0.5175 | 0.05 | 290,379 | ||
This means that the energy costs of the boiler circuit pump are reduced by up to 90 % annually when using a frequency converter, as shown in the annual curve above. The additional costs for this frequency converter on the pump pay for themselves within a year. Due to the increased efficiency, fuel consumption and therefore CO2 emissions at the system are reduced.